Key figures
Turnover in the Icelandic film industry according to Statistic Iceland
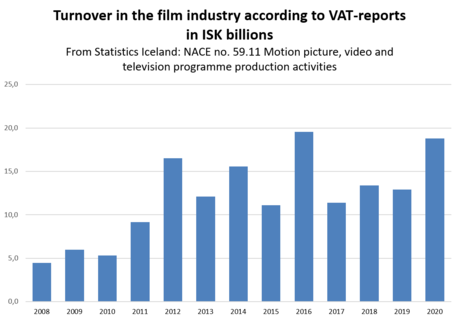
The picture below shows the turnover in motion picture, video and television programme production activities according to VAT-reports in ISK billions. Further information can be found at the website of Statistic Iceland by selecting the activity no. 59.11 - motion picture, video and television programme production activities.
The Icelandic cinema market share
This overview of the last few years clearly demonstrates the dominance of American films in Iceland. Their market share is usually around 85-90% but can swing in both directions by year.
American films are also the majority of all films screened in Iceland, but domestic film festivals and arthouse cinemas have increased the diversity of world cinema in recent years.
The market share of Icelandic films may seem low in this context, but two things should be kept in mind; the Icelandic cinema market is proportionally quite large (attendance pr. capita is usually around 4-5 in Iceland, when the European average is around 2) - and the average attendance to domestic films is quite high, or around 5% of the population. That's a lot higher than the average attendance to domestic films in the other Nordic countries.
| 2020 | 2019 | 2018 | 2017 | 2016 | 2015 | 2014 | |
|---|---|---|---|---|---|---|---|
| Icelandic feature films premiered in cinemas |
4 | 10 | 9 | 7 | 4 | 8 | 8 |
| Icelandic documentaries premiered in cinemas |
4 | 6 | 6 | 10 | 10 | 8 | n/a |
| Cinemas |
17 | 17 | 15 | 15 | 15 | 15 | |
| Cinemas - digitally equipped |
17 | 17 | 14 | 14 | 14 | 14 | |
| Cinema screens |
43 | 43 | 40 | 40 | 41 | 40 | |
| Cinema screens - digitally equipped |
43 | 40 | 39 | 39 | 39 | 39 | |
| Cinema screens - 3D equipped |
30 | 30 | 30 | 30 | 30 | 30 | |
| Cinema seats |
6.551 | 6.604 | 6.828 | 6.833 | 7.054 | 6.799 | |
| Average ticket price excl. VAT |
934,8 kr. | 892,5 kr. | 842 kr. | 829 kr. | |||
| Average ticket price incl. VAT |
1.306kr | 1.247 kr. | 1.242 kr. | 1.230 kr. | 1.190 kr. | 1.123 kr. | 1105 kr. |
| Admissions (total) |
507.927 | 1.267.298 | 1.445.445 | 1.373.178 | 1.420.503 | 1.382.494 | 1.344.569 |
| Admissions per capita |
3,5 | 3,9 | 4,3 | 4,2 | 4,1 | ||
| Admissions - Icelandic films |
69.586 | 53.871 | 163.885 | 122.591 | 91.221 | 61.847 | 148.146 |
| GBO (total) |
663.243.954 kr | 1.580.370.576 kr | 1.796.654.876 kr. | 1.689.529.817 kr. |
1.689.783.655 kr. |
1.551.569.621 kr. | 1.485.618.475 kr. |
| GBO - Icelandic films |
115.000.000 kr | 76.000.000 kr | 240.000.000 kr. | 189.460.952 kr. | 111.521.594 kr. | 73.824.318 kr. | 196.952.859 kr. |
| GBO - US films |
1.442.759.208 kr. | 1.527.995.946 kr. | 1.334.446.458 kr. | 1.247.598.640 kr. | |||
| GBO - European films |
56.349.767 kr. | 49.033.245 kr. | 136.295.356 kr. | 41.066.976 kr. | |||
| GBO - Other films (ROW) |
959.890 kr. | 1.232.870 kr. | 7.003.489 kr. | 0 kr. | |||
| Icelandic films market share |
17% | 4,8% | 13,3% | 11,2% | 6,6% | 4,8% | 13,3% |
| US films market share |
91% | 84,3% | 85,4% | 90,4% | 86% | 84% | |
| European films market share |
3,3% | 2,9% | 8,7% | 2,7% | |||
| Other films (ROW) market share |
0,1% | 0,1% | 0,5% | 0% |