Previous years - Gender equality
Filmmaking is an expensive and complicated process, and a great number of people are involved in the making of each film. Below are figures from the years 2012 - 2019 compiled solely on key positions –screenwriters, directors and producers – in accordance with comparable statistics abroad, for example in Sweden.
These positions are pivotal when it comes to demonstrating the voices and perspectives of women. A number of women have been involved in other positions, both creatively and production-wise, and their reputation has been widely celebrated, both domestically and internationally, even though their work is not included in these figures.
In the tables and figures below you can see the number of production grants and letters of intent awarded by the gender of screenwriters, directors and producers for full-length features, fictional TV series, documentaries and short films. The tables below also show the success rate of the approvals by gender and category.
2021 Result of applications for production grants by gender
In 2021 the Icelandic Film Fund received a total of 228 applications for various types of grants, plus an additional 7 applications that were part of a special governmental campaign intended to counteract the economic challenges to the film industry brought upon by the coronavirus pandemic.
The 228 normal applications in 2021 were an decrease from 278 the previous year. Of those 228, 138 (or 60%) were awarded grants. Further information on the 7 applications that were part of the special coronavirus campaign can be found below.
Table 1: Here you can see the total number of applications, and the percentage of those awarded grants, by type of grant.
| Type of grant | Applications | Awarded | Success rate |
| Script grants | 121 | 73 | 60% |
| Development grants | 25 | 22 | 88% |
| Production grants | 75 | 36 | 48% |
| Special coronavirus campaign | 7 | 7 | 100% |
| Total | 228 | 138 | 60% |
Production grants by gender
Table 2: Here you can see the percentage of production or postproduction grants awarded, for different types of projects, by gender of producer.
| Narrative features | Applications | Awarded | Success rate |
| Men | 14 | 5 | 36% |
| Women | 7 | 3 | 43% |
| Team of men and women | 4 | 3 | 75% |
| Total | 25 | 11 | 44% |
| Documentaries | |||
| Men | 9 | 3 | 33% |
| Women | 8 | 7 | 88% |
| Team of men and women | 3 | 2 | 67% |
| Total | 20 | 12 | 60% |
| Short films | |||
| Men | 4 | 1 | 25% |
| Women | 11 | 4 | 36% |
| Team of men and women | 1 | 1 | 100% |
| Total | 16 | 6 | 38% |
| Narrative TV series | |||
| Men | 4 | 2 | 50% |
| Women | 1 | 1 | 100% |
| Team of men and women | 3 | 3 | 100% |
| Total | 8 | 6 | 75% |
| Postproduction | |||
| Men | 6 | 1 | 17% |
| Women | - | - | - |
| Team of men and women | - | - | - |
| Total | 6 | 1 | 17% |
Table 3: Here you can see the percentage of production or postproduction grants awarded, for different types of projects, by gender of screenwriter.
| Narrative features | Applications | Awarded | Success rate |
| Men | 20 | 7 | 35% |
| Women | 3 | 3 | 100% |
| Team of men and women | 2 | 1 | 50% |
| Total | 25 | 11 | 44% |
| Documentaries | |||
| Men | 12 | 5 | 42% |
| Women | 6 | 5 | 83% |
| Team of men and women | 2 | 2 | 100% |
| Total | 20 | 12 | 60% |
| Short films | |||
| Men | 6 | 2 | 33% |
| Women | 9 | 4 | 44% |
| Team of men and women | 1 | 0 | 0% |
| Total | 16 | 6 | 38% |
| Narrative TV series | |||
| Men | 3 | 1 | 33% |
| Women | 2 | 2 | 100% |
| Team of men and women | 3 | 3 | 100% |
| Total | 8 | 6 | 75% |
| Postproduction | |||
| Men | 6 | 1 | 17% |
| Women | - | - | - |
| Team of men and women | - | - | - |
| Total | 6 | 1 | 17% |
Table 4: Here you can see the percentage of production or postproduction grants awarded, for different types of projects, by gender of director.
| Narrative features | Applications | Awarded | Success rate |
| Men | 20 | 6 | 30% |
| Women | 5 | 5 | 100% |
| Team of men and women | - | - | - |
| Total | 25 | 11 | 44% |
| Documentaries | |||
| Men | 14 | 7 | 50% |
| Women | 4 | 4 | 100% |
| Team of men and women | 2 | 1 | 50% |
| Total | 20 | 12 | 60% |
| Short films | |||
| Men | 6 | 2 | 33% |
| Women | 10 | 4 | 40% |
| Team of men and women | - | - | - |
| Total | 16 | 6 | 38% |
| Narrative TV series | |||
| Men | 6 | 4 | 67% |
| Women | 1 | 1 | 100% |
| Team of men and women | 1 | 1 | 100% |
| Total | 8 | 6 | 75% |
| Postproduction | |||
| Men | 6 | 1 | 17% |
| Women | - | - | - |
| Team of men and women | - | - | - |
| Total | 6 | 1 | 17% |
Development grants by gender
Table 5: Here you can see the percentage of development grants awarded, for different types of projects, by gender of producer.
| Narrative features | Applications | Awarded | Success rate |
| Men | 3 | 3 | 100% |
| Women | 2 | 2 | 100% |
| Team of men and women | - | - | - |
| Total | 5 | 5 | 100% |
| Documentaries | |||
| Men | 7 | 5 | 71% |
| Women | 9 | 8 | 89% |
| Team of men and women | 3 | 3 | 100% |
| Total | 19 | 16 | 84% |
| Narrative TV series | |||
| Men | - | - | - |
| Women | - | - | - |
| Team of men and women | 1 | 1 | 100% |
| Total | 1 | 1 | 100% |
Table 6: Here you can see the percentage of development grants awarded, for different types of projects, by gender of screenwriter.
| Narrative features | Applications | Awarded | Success rate |
| Men | 4 | 4 | 100% |
| Women | 1 | 1 | 100% |
| Team of men and women | - | - | - |
| Total | 5 | 5 | 100% |
| Documentaries | |||
| Men | 12 | 10 | 83% |
| Women | 6 | 5 | 83% |
| Team of men and women | 1 | 1 | 100% |
| Total | 19 | 16 | 84% |
| Narrative TV series | |||
| Men | - | - | - |
| Women | - | - | - |
| Team of men and women | 1 | 1 | 100% |
| Total | 1 | 1 | 100% |
Table 7: Here you can see the percentage of development grants awarded, for different types of projects, by gender of director.
| Narrative features | Applications | Awarded | Success rate |
| Men | 4 | 4 | 100% |
| Women | 1 | 1 | 100% |
| Team of men and women | - | - | - |
| Total | 5 | 5 | 100% |
| Documentaries | |||
| Men | 12 | 10 | 83% |
| Women | 6 | 5 | 83% |
| Team of men and women | 1 | 1 | 100% |
| Total | 19 | 16 | 84% |
| Narrative TV series | |||
| Men | 1 | 1 | 100% |
| Women | - | - | - |
| Team of men and women | - | - | - |
| 1 | 1 | 100% |
Script grants by gender
Table 8: Here you can see the percentage of script grants awarded, for different types of projects, by gender of screenwriter.
| Narrative features | Applications | Awarded | Success rate |
| Men | 52 | 27 | 52% |
| Women | 14 | 11 | 79% |
| Team of men and women | - | - | - |
| Total | 66 | 38 | 58% |
| Documentaries | |||
| Men | 5 | 3 | 60% |
| Women | 5 | 4 | 80% |
| Team of men and women | 2 | 2 | 100% |
| Total | 12 | 9 | 75% |
| Narrative TV series | |||
| Men | 20 | 10 | 50% |
| Women | 14 | 10 | 71% |
| Team of men and women | 9 | 6 | 67% |
| Total | 43 | 26 | 60% |
2020 Result of applications for production grants by gender
In 2020 the Icelandic Film Fund received a total of 278 applications for various types of grants, plus an additional 67 applications that were part of a special governmental campaign intended to counteract the economic challenges to the film industry brought upon by the coronavirus pandemic.
The 278 normal applications in 2020 were an increase from 180 the previous year. Of those 278, 135 (or 49%) were awarded grants. Further information on the 67 applications that were part of the special coronavirus campaign can be found below.
Table 1: Here you can see the total number of applications, and the percentage of those awarded grants, by type of grant.
| Type of grant | Applications | Awarded | Success rate |
| Script grants | 161 | 75 | 47% |
| Development grants | 31 | 20 | 65% |
| Production grants | 86 | 40 | 47% |
| Total | 278 | 135 | 49% |
Production grants by gender
Table 2: Here you can see the percentage of production or postproduction grants awarded, for different types of projects, by gender of producer.
| Narrative features | Applications | Awarded | Success rate |
| Men | 12 | 3 | 25% |
| Women | 5 | 2 | 40% |
| Team of men and women | 6 | 2 | 33% |
| Total | 23 | 7 | 30% |
| Documentaries | |||
| Men | 17 | 11 | 65% |
| Women | 9 | 6 | 67% |
| Team of men and women | 5 | 1 | 20% |
| Total | 31 | 14 | 58% |
| Short films | |||
| Men | 2 | 2 | 100% |
| Women | 7 | 3 | 43% |
| Team of men and women | 5 | 2 | 40% |
| Total | 14 | 7 | 50% |
| Narrative TV series | |||
| Men | 1 | 0 | 0% |
| Women | 1 | 1 | 100% |
| Team of men and women | 6 | 4 | 67% |
| Total | 8 | 4 | 63% |
| Postproduction | |||
| Men | 10 | 3 | 30% |
| Women | - | - | - |
| Team of men and women | - | - | - |
| Total | 10 | 3 | 30% |
Table 3: Here you can see the percentage of production or postproduction grants awarded, for different types of projects, by gender of screenwriter.
| Narrative features | Applications | Awarded | Success rate |
| Men | 16 | 4 | 25% |
| Women | 4 | 1 | 25% |
| Team of men and women | 3 | 2 | 67% |
| Total | 23 | 7 | 30% |
| Documentaries | |||
| Men | 20 | 10 | 50% |
| Women | 5 | 4 | 80% |
| Team of men and women | 6 | 4 | 67% |
| Total | 31 | 18 | 58% |
| Short films | |||
| Men | 6 | 2 | 33% |
| Women | 8 | 5 | 63% |
| Total | 14 | 7 | 50% |
| Narrative TV series | |||
| Men | - | - | - |
| Women | 3 | 2 | 67% |
| Team of men and women | 5 | 3 | 60% |
| Total | 8 | 5 | 63% |
| Postproduction | |||
| Men | 8 | 3 | 38% |
| Women | 2 | 0 | 0% |
| Team of men and women | - | - | - |
| Total | 10 | 3 | 30% |
Table 4: Here you can see the percentage of production or postproduction grants awarded, for different types of projects, by gender of director.
| Narrative features | Applications | Awarded | Success rate |
| Men | 18 | 6 | 33% |
| Women | 4 | 1 | 25% |
| Team of men and women | 1 | 0 | 0% |
| Total | 23 | 7 | 30% |
| Documentaries | |||
| Men | 22 | 12 | 55% |
| Women | 6 | 4 | 67% |
| Team of men and women | 3 | 2 | 67% |
| Total | 31 | 18 | 58% |
| Short films | |||
| Men | 6 | 2 | 33% |
| Women | 8 | 5 | 63% |
| Team of men and women | - | - | - |
| Total | 14 | 7 | 50% |
| Narrative TV series | |||
| Men | 5 | 3 | 60% |
| Women | 2 | 1 | 50% |
| Team of men and women | 1 | 1 | 100% |
| Total | 8 | 5 | 63% |
| Postproduction | |||
| Men | 8 | 3 | 38% |
| Women | 2 | 0 | 0% |
| Team of men and women | - | - | - |
| Total | 10 | 3 | 30% |
Development grants by gender
Table 5: Here you can see the percentage of development grants awarded, for different types of projects, by gender of producer.
| Narrative features | Applications | Awarded | Success rate |
| Men | 3 | 2 | 67% |
| Women | 2 | 2 | 100% |
| Team of men and women | 3 | 2 | 67% |
| Total | 8 | 6 | 75% |
| Documentaries | |||
| Men | 7 | 5 | 71% |
| Women | 10 | 6 | 60% |
| Team of men and women | 6 | 3 | 50% |
| Total | 23 | 14 | 61% |
Table 6: Here you can see the percentage of development grants awarded, for different types of projects, by gender of screenwriter.
| Narrative features | Applications | Awarded | Success rate |
| Men | 6 | 4 | 67% |
| Women | - | - | - |
| Team of men and women | 2 | 2 | 100% |
| Total | 8 | 6 | 75% |
| Documentaries | |||
| Men | 11 | 7 | 64% |
| Women | 8 | 6 | 75% |
| Team of men and women | 4 | 1 | 25% |
| Total | 16 | 11 | 61% |
Table 7: Here you can see the percentage of development grants awarded, for different types of projects, by gender of director.
| Narrative features | Applications | Awarded | Success rate |
| Men | 6 | 4 | 67% |
| Women | 2 | 2 | 100% |
| Team of men and women | - | - | - |
| Total | 8 | 6 | 75% |
| Documentaries | |||
| Men | 12 | 7 | 58% |
| Women | 11 | 7 | 64% |
| Team of men and women | - | - | - |
| Total | 23 | 14 | 61% |
Script grants by gender
Table 8: Here you can see the percentage of script grants awarded, for different types of projects, by gender of screenwriter.
| Narrative features | Applications | Awarded | Success rate |
| Men | 71 | 35 | 49% |
| Women | 21 | 11 | 52% |
| Team of men and women | 2 | 0 | 0% |
| Total | 94 | 46 | 49% |
| Documentaries | |||
| Men | 13 | 6 | 46% |
| Women | 11 | 4 | 36% |
| Team of men and women | 3 | 2 | 67% |
| Total | 27 | 12 | 44% |
| Narrative TV series | |||
| Men | 20 | 8 | 40% |
| Women | 15 | 7 | 47% |
| Team of men and women | 5 | 2 | 40% |
| Total | 36 | 19 | 43% |
Special coronavirus campaign by gender
Table 9: Here you can see the percentage of grants awarded by gender of producer.
| Applications | Awarded | Success rate | |
| Men | 30 | 6 | 20% |
| Women | 19 | 4 | 21% |
| Team of men and women | 18 | 3 | 16.7% |
| Total | 67 | 13 | 19.4% |
Table 10: Here you can see the percentage of grants awarded by gender of screenwriter.
| Applications | Awarded | Success rate | |
| Men | 26 | 4 | 15.4% |
| Women | 23 | 5 | 21.7% |
| Team of men and women | 28 | 4 | 22.2% |
| Total | 67 | 13 | 19.4% |
Table 11: Here you can see the percentage of grants awarded by gender of director.
| Applications | Awarded | Success rate | |
| Men | 38 | 6 | 15.8% |
| Women | 25 | 7 | 28% |
| Team of men and women | 3 | 0 | 0% |
| Total | 66* | 13 | 19.7% |
*One application didn't have a director.
2019 Result of applications for production grants by gender
In the last few years the issue of women in Icelandic filmmaking has been a common debate in news outlets and on social media. The Icelandic Film Centre has gathered data on this matter and published it.
It should be remembered that, relative to our Nordic and European partners, the Icelandic Film Fund is small, as is our industry. On average, we are able to support only three to four feature-length fiction films per year, in addition to a handful of documentaries, short films and fiction TV series. This means that our sample size is also small, and large swings in data from year to year are possible. With this in mind, we think this data gives us some indication of the larger picture and the trends that have been emerging in recent years.
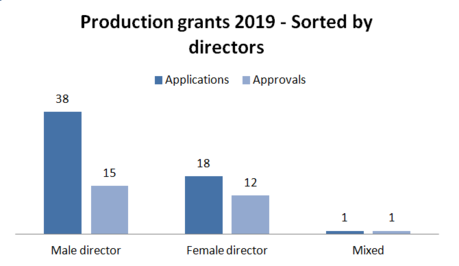
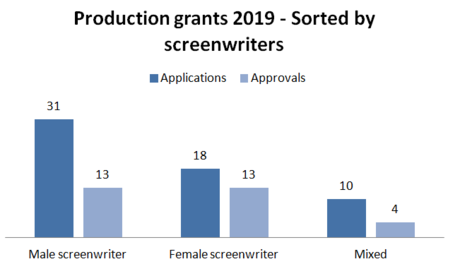
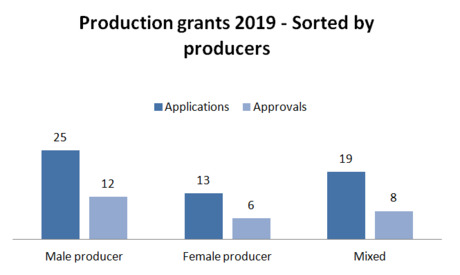
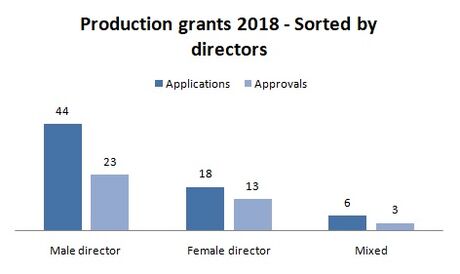
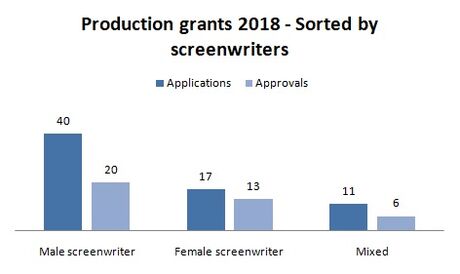
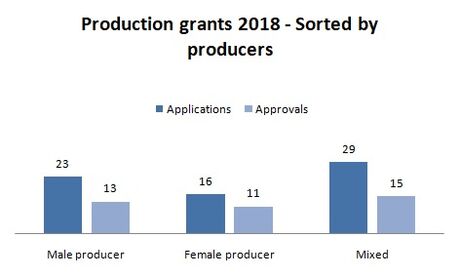
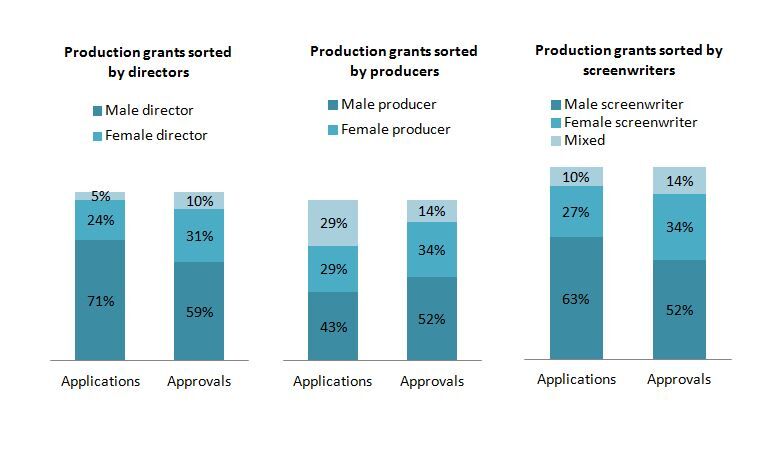
Figure 1-3 show production grants for funded projects in all categories in 2019; feature films, documentaries, short films and fiction TV series. Female applications are little above than 30% of all applications received. As figures 1-3 show, the success rate of female applicants is high.
Historically, film making has been a male-dominated field, and efforts to correct this imbalance should be encouraged and applauded. All of the stakeholders in the industry have a role to play in this effort. For our part, the Icelandic Film Centre takes these questions very seriously, and we believe that we have a responsibility to encourage greater participation of Icelandic women in film making and to ensure that grant applications by women filmmakers are given equal consideration to those by their male counterparts, so that our funding practices strive toward a balanced representation according to gender. It should be noted that applications for financial support on script writing are sent nameless (blind) to our consultants for advisory.
Every four years or so, the Icelandic government and the main film making bodies, make an agreement on general film policy for the relevant period. The agreement covers the total amount of state financial support for film making for each year, subject to approval from Althingi, the parliament. In the current agreement (2016-2019) a special emphasis has been made on increasing the participation of women in key roles of film making.
The Icelandic Film Centre reacted to the agreement by making proposals which were unanimously agreed on by The Film Board. Subsequently the proposals were introduced to The Icelandic Ministry of Culture which still has not responded. The proposal can be found here (Icelandic only).
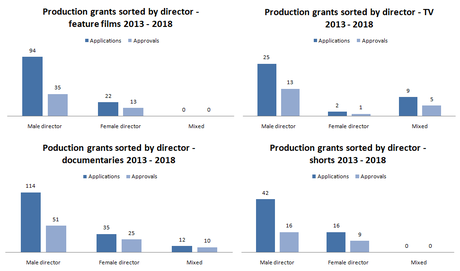
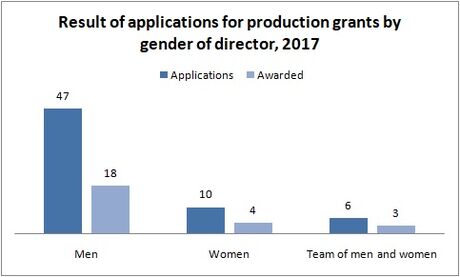
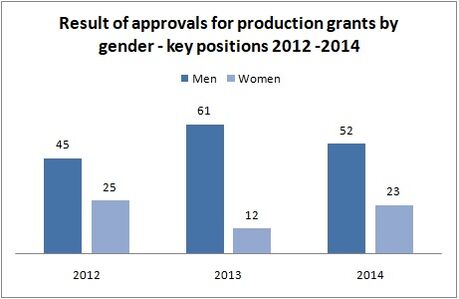
Figure 4 shows production grants for funded projects sorted by the gender of directors and categories over the years 2013-2018. Female applications are approximately 20% of all applicants.
We are in agreement with our Nordic and European colleagues about the seriousness of this issue, and about many of the measures being taken by our sister organizations to bring more female voices to the filmmaking table. Stories by women, for women and about women are an essential component of any society and our understanding of our place in the world.
The role of our consultants
The Icelandic Film Centre employs several consultants who are experienced professionals in various aspects of the field of filmmaking. The consultants' primary responsibility is to read and evaluate grant applications and to advise the director of the Icelandic Film Centre on the merits of those applications for support. Support is given based on merit, and applications are evaluated according to time-tested, objective criteria used industry-wide. In addition, consultants are encouraged to keep in mind the criteria laid down in the Bechdel test, and to consider whether the script content of the projects they are evaluating promotes well-rounded, three-dimensional female characters. Applicants, too, are encouraged to apply these same criteria to the content of their work.
The Bechdel Test is a basic measure to see if women are fairly represented in a film. For a film to pass The Bechdel Test, the movie must simply have the following:
1. It must have at least two female characters
2. They must both have names
3. They must talk to each other about something other than a man
Better tracking of data
As we begin to upgrade to a new and more efficient electronic application system, we will also be initiating a new system for collecting and tracking data on applicants. As part of this system, applicants will be able to indicate the gender of the key participants in their projects, both at the application stage and when settling their accounts with the fund after production has been completed. This data will provide us with a clearer understanding of participation by gender so that we will be aware of, and be able to address, gender imbalances in a more timely manner.
2018 Result of applications for production grants by gender
Tables 1 - 3 show the results of applications for production grants by gender of director, screenwriter and producer, sorted by film categories (narrative features, short films, TV series and documentaries).
Table 1. Result of applications for production grants by gender of director, 2018
| Applications | Awarded | Success rate | |
| Narrative features | |||
| Men | 18 | 7 | 39% |
| Women | 6 | 5 | 83% |
| Total | 24 | 12 | 50% |
| Short films | |||
| Men | 8 | 3 | 38% |
| Women | 2 | 1 | 50% |
| Total | 10 | 4 | 40% |
| Narrative TV series | |||
| Men | 3 | 2 | 67% |
| Women | 2 | 1 | 50% |
| Team of men and women | 5 | 2 | 40% |
| Total | 10 | 5 | 50% |
| Documentaries | |||
| Men | 15 | 11 | 73% |
| Women | 8 | 6 | 75% |
| Team of men and women | 1 | 1 | 100% |
| Total | 24 | 18 | 75% |
Table 2. Result of applications for production grants by gender of screenwriter, 2018
| Applications | Awarded | Success rate | |
| Narrative features | |||
| Men | 17 | 7 | 41% |
| Women | 4 | 3 | 75% |
| Team of men and women | 3 | 2 | 67% |
| Total | 24 | 12 | 50% |
| Short films | |||
| Men | 8 | 3 | 38% |
| Women | 2 | 1 | 50% |
| Team of men and women | |||
| Total | 10 | 4 | 40% |
| Narrative TV series | |||
| Men | 3 | 2 | 67% |
| Women | 2 | 1 | 50% |
| Team of men and women | 5 | 2 | 40% |
| Total | 10 | 5 | 50% |
| Documentaries | |||
| Men | 12 | 8 | 67% |
| Women | 9 | 8 | 89% |
| Team of men and women | 3 | 2 | 67% |
| Total | 24 | 18 | 75% |
Table 3. Result of applications for production grants by gender of producer, 2018
| Applications | Awarded | Success rate | |
| Narrative features | |||
| Men | 7 | 3 | 43% |
| Women | 5 | 3 | 60% |
| Team of men and women | 12 | 6 | 50% |
| Total | 24 | 12 | 50% |
| Short films | |||
| Men | 6 | 3 | 50% |
| Women | 2 | 1 | 50% |
| Team of men and women | 2 | 0% | |
| Total | 10 | 4 | 40% |
| Narrative TV series | |||
| Men | 3 | 2 | 67% |
| Women | |||
| Team of men and women | 7 | 3 | 43% |
| Total | 10 | 5 | 50% |
| Documentaries | |||
| Men | 7 | 5 | 71% |
| Women | 9 | 7 | 78% |
| Team of men and women | 8 | 6 | 75% |
| Total | 24 | 18 | 75% |
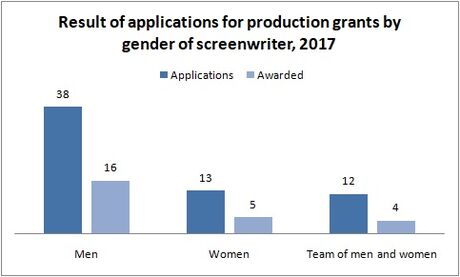
2017 Result of applications for production grants by gender
Result of applications for production grants by gender of director, 2017
| Applications | Awarded | Success rate |
|
| Narrative features | |||
| Men | 17 | 6 | 35% |
| Women | 1 | 0 | 0% |
| Total | 18 | 6 | 33% |
| Short films | |||
| Men | 13 | 6 | 46% |
| Women | 3 | 1 | 33% |
| Total | 16 | 7 | 44% |
| Narrative TV series | |||
| Men | 6 | 1 | 17% |
| Women | 0 | 0 | - |
| Team of men and women | 2 | 1 | 50% |
| Total | 8 | 2 | 25% |
| Documentaries | |||
| Men | 11 | 5 | 45% |
| Women | 6 | 3 | 50% |
| Team of men and women | 4 | 2 | 50% |
| Total | 21 | 10 | 48% |
Result of applications for production grants by gender of screenwriter, 2017
| Applications | Awarded | Success rate | |
| Narrative features | |||
| Men | 15 | 6 | 40% |
| Women | 2 | 0 | 0% |
| Team of men and women | 1 | 0 | 0% |
| Total | 18 | 6 | 33% |
| Short films | |||
| Men | 13 | 6 | 46% |
| Women | 3 | 1 | 33% |
| Total | 16 | 7 | 44% |
| Narrative TV series | |||
| Men | 3 | 0 | 0% |
| Women | 1 | 1 | 100% |
| Team of men and women | 4 | 1 | 25% |
| Total | 8 | 2 | 25% |
| Documentaries | |||
| Men | 7 | 4 | 57% |
| Women | 7 | 3 | 43% |
| Team of men and women | 7 | 3 | 43% |
| Total | 21 | 10 | 48% |
Result of applications for production grants by gender of producer, 2017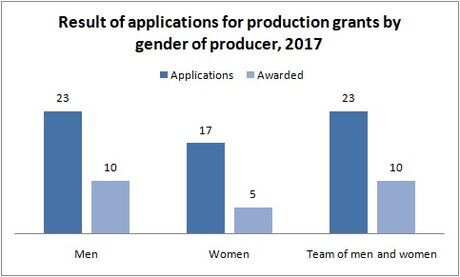
| Applications | Awarded | Success rate | |
| Narrative features | |||
| Men | 9 | 3 | 33% |
| Women | 1 | 1 | 100% |
| teymi kk og kvk | 8 | 2 | 25% |
| samtals | 18 | 6 | 33% |
| Short films | |||
| Men | 3 | 1 | 33% |
| Women | 6 | 2 | 33% |
| teymi kk og kvk | 7 | 4 | 57% |
| samtals | 16 | 7 | 44% |
| Narrative TV series | |||
| Men | 4 | 1 | 25% |
| Women | 1 | 0 | 0% |
| teymi kk og kvk | 3 | 1 | 33% |
| samtals | 8 | 2 | 25% |
| Documentaries | |||
| Men | 7 | 5 | 71% |
| Women | 9 | 2 | 22% |
| teymi kk og kvk | 5 | 3 | 60% |
| samtals | 21 | 10 | 48% |
2016 Result of applications for production grants by gender
The figure below shows the rate of applications and approvals out of all production grants in the year 2016, sorted by gender of applicants in all film categories (full-length features, fictional TV series, documentaries and short films).
It is clear that female applicants are fewer than male applicants, but women's success rate of receiving approvals is higher.
| Result of applications for production grants by gender of director, 2016 | Applications | Awarded | Success rate |
| Narrative features | |||
| Men | 21 | 5 | 24% |
| Women | 3 | 1 | 33% |
| Total | 24 | 6 | 25% |
| Short films | |||
| Men | 6 | 1 | 17% |
| Women | 5 | 3 | 60% |
| Total | 11 | 4 | 36% |
| Narrative TV series | |||
| Men | 2 | 1 | 50% |
| Women | 0 | 0 | |
| Team of men and women | 1 | 1 | 100% |
| Total | 3 | 2 | 67% |
| Documentaries | |||
| Men | 16 | 10 | 63% |
| Women | 7 | 5 | 71% |
| Team of men and women | 2 | 2 | 100% |
| Total | 25 | 17 | 68% |
| Result of applications for production grants by gender of producer, 2016 | Applications | Awarded | Success rate |
| Narrative features | |||
| Men | 10 | 2 | 20% |
| Women | 5 | 3 | 60% |
| Team of men and women | 9 | 1 | 22% |
| Total | 24 | 6 | 25% |
| Short films | |||
| Men | 2 | 1 | 50% |
| Women | 8 | 3 | 38% |
| Team of men and women | 1 | 0 | 0% |
| Total | 11 | 4 | 36% |
| Narrative TV series | |||
| Men | 1 | 1 | 100% |
| Women | 0 | 0 | |
| Team of men and women | 2 | 1 | 50% |
| Total | 3 | 2 | 67% |
| Documentaries | |||
| Men | 14 | 9 | 64% |
| Women | 5 | 5 | 100% |
| Team of men and women | 6 | 3 | 50% |
| Total | 25 | 17 | 68% |
| Result of applications for production grants by gender of screenwriter, 2016 | Applications | Awarded | Success rate |
| Narrative features | |||
| Men | 19 | 4 | 21% |
| Women | 3 | 1 | 33% |
| Team of men and women | 2 | 1 | 50% |
| Total | 24 | 6 | 25% |
| Short films | |||
| Men | 6 | 1 | 17% |
| Women | 5 | 3 | 60% |
| Total | 11 | 4 | 36% |
| Narrative TV series | |||
| Men | 0 | 0 | |
| Women | 1 | 0 | 0% |
| Team of men and women | 2 | 2 | 100% |
| Total | 3 | 2 | 67% |
| Documentaries | |||
| Men | 15 | 10 | 67% |
| Women | 8 | 6 | 75% |
| Team of men and women | 2 | 1 | 50% |
| Total | 25 | 17 | 68% |
2015 Result of applications for production grants by gender
| Result of applications for production grants by gender of director, 2015 | Applications | Awarded | Success rate |
| Narrative features | |||
| Men | 11 | 2 | 18% |
| Women | 3 | 2 | 67% |
| Total | 14 | 4 | 29% |
| Short films | |||
| Men | 3 | 1 | 33% |
| Women | 2 | 2 | 100% |
| Total | 5 | 3 | 60% |
| Narrative TV series | |||
| Men | 2 | 1 | 50% |
| Women | 0 | 0 | not applicable |
| Total | 2 | 1 | 50% |
| Documentaries | |||
| Men | 13 | 5 | 38% |
| Women | 4 | 3 | 75% |
| Team of men and women | 2 | 2 | 100% |
| Total | 19 | 10 | 53% |
| Result of applications for production grants by gender of screenwriter, 2015 | Applications | Awarded | Success rate |
| Narrative features | |||
| Men | 10 | 2 | 20% |
| Women | 3 | 1 | 33% |
| Team of men and women | 1 | 1 | 100% |
| Total | 14 | 4 | 29% |
| Short films | |||
| Men | 3 | 1 | 33% |
| Women | 2 | 2 | 100% |
| Total | 5 | 3 | 60% |
| Narrative TV series | |||
| Men | 2 | 1 | 50% |
| Women | 0 | 0 | not applicable |
| Total | 2 | 1 | 50% |
| Documentaries | |||
| Men | 13 | 5 | 38% |
| Women | 4 | 3 | 75% |
| Team of men and women | 2 | 2 | 100% |
| Total | 19 | 10 | 53% |
| Result of applications for production grants by gender of producer, 2015 | Applications | Awarded | Success rate |
| Narrative features | |||
| Men | 7 | 2 | 29% |
| Women | 1 | 0 | 0% |
| Team of men and women | 6 | 2 | 33% |
| Total | 14 | 4 | 29% |
| Short films | |||
| Men | 3 | 2 | 67% |
| Women | 2 | 1 | 50% |
| Total | 5 | 3 | 60% |
| Narrative TV series | |||
| Men | 2 | 1 | 50% |
| Women | 0 | 0 | not applicable |
| Total | 2 | 1 | 50% |
| Documentaries | |||
| Men | 10 | 2 | 20% |
| Women | 7 | 6 | 46% |
| Team of men and women | 2 | 2 | 100% |
| Total | 19 | 10 | 53% |
2012 - 2014 Result of applications for production grants by gender
| Result of applications for production grants by gender of director, 2014 | Applications | Awarded | Success rate |
| Narrative features | |||
| Men | 13 | 8 | 62% |
| Women | 6 | 4 | 67% |
| Total | 19 | 12 | 63% |
| Short films | |||
| Men | 3 | 0 | 0% |
| Women | 2 | 0 | 0% |
| Total | 5 | 0 | 0% |
| Narrative TV series | |||
| Men | 7 | 3 | 43% |
| Women | 0 | 0 | not applicable |
| Total | 7 | 3 | 43% |
| Documentaries | |||
| Men | 24 | 8 | 33% |
| Women | 5 | 4 | 75% |
| Team of men and women | 1 | 1 | 100% |
| Total | 30 | 13 | 43% |
| Result of applications for production grants by gender of screenwriter, 2014 | Applications | Awarded | Success rate |
| Narrative features | |||
| Men | 14 | 8 | 57% |
| Women | 4 | 3 | 75% |
| Team of men and women | 1 | 1 | 100% |
| Total | 19 | 12 | 63% |
| Short films | |||
| Men | 3 | 0 | 0% |
| Women | 2 | 0 | 0% |
| Total | 5 | 0 | 0% |
| Narrative TV series | |||
| Men | 5 | 1 | 20% |
| Women | 1 | 1 | 100% |
| Team of men and women | 1 | 1 | 100% |
| Total | 7 | 3 | 43% |
| Documentaries | |||
| Men | 21 | 9 | 43% |
| Women | 7 | 4 | 57% |
| Team of men and women | 2 | 0 | 0% |
| Total | 30 | 13 | 43% |
| Result of applications for production grants by gender of producer, 2014 | Applications | Awarded | Success rate |
| Narrative features | |||
| Men | 12 | 8 | 67% |
| Women | 4 | 2 | 50% |
| Team of men and women | 3 | 2 | 67% |
| Total | 19 | 12 | 63% |
| Short films | |||
| Men | 2 | 0 | 0% |
| Women | 3 | 0 | 0% |
| Team of men and women | 5 | 0 | 0% |
| Total | |||
| Narrative TV series | |||
| Men | 3 | 1 | 33% |
| Women | 1 | 0 | 0% |
| Team of men and women | 3 | 2 | 67% |
| Total | 7 | 3 | 43 |
| Documentaries | |||
| Men | 17 | 6 | 35% |
| Women | 10 | 5 | 50% |
| Team of men and women | 3 | 2 | 67% |
| Total | 30 | 13 | 43% |
| Result of applications for production grants by gender of director, 2013 | Applications | Awarded | Success rate |
| Narrative features | |||
| Men | 13 | 6 | 46% |
| Women | 3 | 1 | 33% |
| Total | 16 | 7 | 44% |
| Short films | |||
| Men | 5 | 4 | 80% |
| Women | 1 | 1 | 100% |
| Total | 6 | 5 | 83% |
| Narrative TV series | |||
| Men | 4 | 4 | 100% |
| Women | 0 | 0 | not applicable |
| Team of men and women | 1 | 1 | 100% |
| Total | 5 | 5 | 100% |
| Documentaries | |||
| Men | 24 | 7 | 29% |
| Women | 4 | 3 | 75% |
| Team of men and women | 2 | 2 | 100% |
| Total | 30 | 12 | 40% |
| Result of applications for productions grants by gender of screenwriter, 2013 | Applications | Awarded | Success rate |
| Narrative features | |||
| Men | 14 | 6 | |
| Women | 2 | 1 | 50% |
| Total | |||
| Short films | |||
| Men | 5 | 4 | 80% |
| Women | 0 | 0 | not applicable |
| Team of men and women | 1 | 1 | 100% |
| Total | 6 | 5 | 83% |
| Narrative TV series | |||
| Men | 4 | 4 | 100% |
| Women | 0 | 0 | not applicable |
| Team of men and women | 1 | 1 | 100% |
| Total | 5 | 5 | 100% |
| Documentaries | |||
| Men | 24 | 8 | 33% |
| Women | 4 | 3 | 75% |
| Team of men and women | 2 | 1 | 50% |
| Total | 30 | 12 | 40% |
| Result of applications for productions grants by gender of producer, 2013 | Applications | Awarded | Success rate |
| Narrative features | |||
| Men | 12 | 6 | 50% |
| Women | 2 | 0 | 0% |
| Team of men and women | 2 | 1 | 50% |
| Total | 16 | 7 | 44% |
| Short films | |||
| Men | 4 | 4 | 100% |
| Women | 0 | 0 | not applicable |
| Team of men and women | 2 | 1 | 50% |
| Total | 6 | 5 | 83% |
| Narrative TV series | |||
| Men | 3 | 3 | 100% |
| Women | 0 | 0 | not applicable |
| Team of men and women | 2 | 2 | 100% |
| Total | 5 | 5 | |
| Documentaries | |||
| Men | 24 | 8 | 33% |
| Women | 4 | 3 | 75% |
| Team of men and women | 2 | 1 | 50% |
| Total | 30 | 12 | 40% |
| Result of applications for production grants by gender of director, 2012 | Applications | Awarded | Success rate |
| Narrative features | |||
| Men | 13 | 4 | 31% |
| Women | 5 | 1 | 20% |
| Total | 18 | 5 | 28% |
| Short films | |||
| Men | 9 | 3 | 33% |
| Women | 4 | 4 | 100% |
| Total | 13 | 7 | 54% |
| Narrative TV series | |||
| Men | 5 | 4 | 80% |
| Women | 1 | 1 | 100% |
| Total | 6 | 5 | 83% |
| Documentaries | |||
| Men | 19 | 7 | 37% |
| Women | 2 | 2 | 100% |
| Total | 21 | 9 | 43% |
| Result of applications for production grants by gender of screenwriter, 2012 | Applications | Awarded | Success rate |
| Narrative features | |||
| Men | 12 | 4 | 33% |
| Women | 6 | 1 | 17% |
| Total | 18 | 5 | 28% |
| Short films | |||
| Men | 9 | 3 | 33% |
| Women | 4 | 4 | 100% |
| Total | 13 | 7 | 54% |
| Narrative TV series | |||
| Men | 2 | 2 | 100% |
| Women | 0 | 0 | not applicable |
| Team of men and women | 4 | 3 | 75% |
| Total | 6 | 5 | 83% |
| Documentaries | |||
| Men | 17 | 6 | 35% |
| Women | 2 | 2 | 100% |
| Team of men and women | 2 | 1 | 50% |
| Total | 21 | 9 | 43% |
| Result of applications for production grants by gender of producer, 2012 | Applications | Awarded | Success rate |
| Narrative features | |||
| Men | 9 | 2 | 22% |
| Women | 4 | 2 | 50% |
| Team of men and women | 5 | 1 | 20% |
| Total | 18 | 5 | |
| Short films | |||
| Men | 8 | 2 | 25% |
| Women | 5 | 5 | 100% |
| Total | 13 | 7 | |
| Narrative TV series | |||
| Men | 3 | 2 | 67% |
| Women | 0 | 0 | not applicable |
| Team of men and women | 3 | 3 | 100% |
| Total | 6 | 5 | |
| Documentaries | |||
| Men | 18 | 6 | 33% |
| Women | 3 | 3 | 100% |
| Total | 21 | 9 | 43% |